English
 繁體中文
If a 3D or AR sales deck has landed in your inbox lately, you have seen the numbers. AR lifts purchase likelihood 65%. 3D viewers lift add-to-cart 44%. One merchant cut returns while raising order conversion 40%. All of these come from real Shopify AR case studies, all of them get quoted endlessly, and almost nobody stops to ask what the numbers were actually measuring, or what they imply for AR conversion on a store like yours.
This piece goes through the four most-quoted figures one by one, asks who was counted and what the comparison was against, and ends with a way to test AR on your own store that does not require believing anyone's deck, including ours.
The four numbers everyone quotes
| Claim | Source | What was actually measured |
|---|---|---|
| +44% add-to-cart, +27% orders after 3D | Rebecca Minkoff, via Shopify | Shoppers who viewed a product as a 3D model vs those who did not, across 50+ product pages |
| +65% purchase after AR | Rebecca Minkoff, via Shopify | Visitors who placed the product in AR vs those who did not |
| +40% order conversion, -5% returns | Gunners Kennels, via Shopify | Before/after adding AR to large dog kennel pages |
| +458% AOV in Germany | Oakywood, via Shopify | Year-over-year after moving to Shopify Plus with 3D scanning and customizers |
Notice something before we go further: these are all vendor-published. Shopify has a product to sell, and the brands benefit from the publicity. That does not make the numbers false. It means each one needs its denominator checked before you plan a quarter around it.
Rebecca Minkoff: the 44 and the 65
The fashion brand put 3D models and AR on more than fifty product pages and reported that shoppers who viewed a product as a 3D model were 44% more likely to add it to cart, and 27% more likely to place an order. The AR figure, 65% more likely to purchase, comes from the same program.
Here is the part the deck omits. These are comparisons between shoppers who chose to interact and shoppers who did not. People who tap a 3D button are, already, more engaged than people who scroll past it; some of that 44% would have converted anyway. That does not erase the effect, interaction probably does build buying confidence, but it means the true lift is smaller than the headline, and nobody outside Shopify can say by how much, because self-selection is baked into the measurement. Treat 44% as an upper bound, not a forecast.
Also worth noticing: fashion. Texture, hardware, how a bag sits on a shoulder. If your product is a pipe fitting, the mechanism transfers more weakly than the number suggests.
Gunners Kennels: the most useful number, and the least quoted
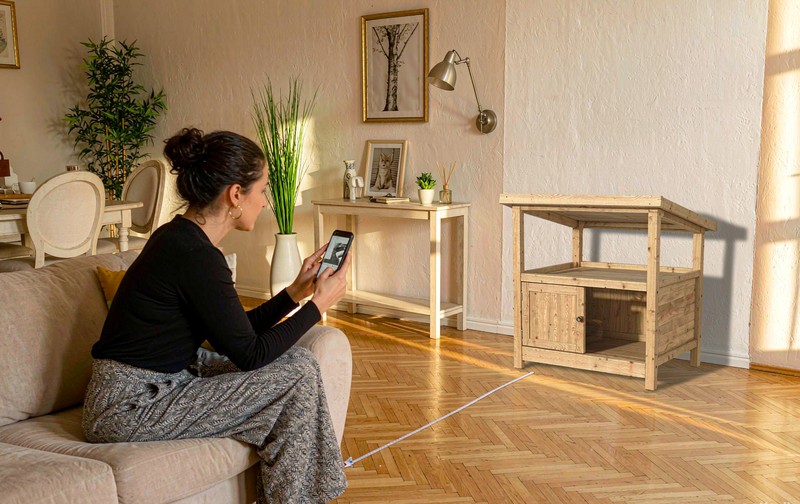
A kennel is a large purchase where size is the whole anxiety: will it fit the dog, will it fit the room. Gunners added AR so shoppers could drop the kennel into their space at true scale, and reported a 3% lift in cart conversion, a 40% lift in order conversion, and a 5% reduction in returns.
Why do I trust this one more? Because the mechanism is legible. A kennel buyer's uncertainty is spatial, AR answers spatial questions directly, and the returns number moves in the direction the mechanism predicts. The chain hangs together. When you evaluate an AR claim, that is the test: does the category's uncertainty match what AR actually resolves? Size and fit anxiety, yes. Color fidelity, partly. Pure style preference, mostly no.
The 3% versus 40% gap teaches something too. Cart conversion barely moved; order conversion jumped. Shoppers were adding to cart at similar rates, but far fewer were abandoning between cart and checkout, which is where spatial doubt does its damage on big-ticket items. If your product is low-priced, expect the pattern to look different, because the risk being resolved is smaller.
Oakywood: the 458% that needs a warning label
Average order value up 458% in Germany, 232% in Switzerland, 84% in the UK. Impressive, and quoted everywhere. Read the source interview closely and the store also rebranded and moved from Etsy to Shopify Plus in the same period, then added scanning and customizers. Three major changes, one number. There is no way to separate what the AR portion contributed, and the brand itself does not claim to. Quoting 458% as an AR result is exactly the kind of number that makes merchants cynical about all of them.
One more number you will meet in these decks: 93% of Snapchat users are interested in shopping with AR, per a Snapchat report. The source is a company that sells AR advertising, reporting on its own user base, a demographic that skews young and gadget-friendly. As a measure of sentiment among Gen Z it is fine. As a forecast of conversion on your catalog it measures nothing.
Where does AR clearly fit, then? Look at the price points in the case studies Shopify itself chose. HORNE sells lamps in the $2,300 to $7,000 range and reports customers sending snapshots of their rooms asking whether a lamp will work, essentially free interior design consulting that AR now handles at scale. Pure Cycles modeled a $2,500 electric bike partly because its compactness, a selling point photos flatten, becomes visible when the bike is dropped into a garage. High-ticket, spatially judged products. That is the pattern across every credible case, and it is a better filter than any percentage.
Three preconditions the press releases skip
Model quality sits above everything else on this list, and it is not a footnote. Every case study above runs on models that load fast and look right at real-world scale. A heavy model on a slow page produces the opposite of these numbers, and the effort that goes into that is the same discipline as preparing CAD files for a web 3D configurator.
Category fit is second. AR resolves spatial uncertainty, so it pays where scale, fit or finish drive the decision, furniture, large appliances, kennels. It is one format on a spectrum of product displays, and where it sits relative to plain viewers and configurators is laid out in interactive 3D product display.
The decision framework for whether AR belongs on a product page at all is the one we laid out for WebAR product visualization, and it applies on Shopify exactly as anywhere else.
Mobile traffic share is third, and it quietly decides your ceiling. AR on Shopify runs through the phone camera, iOS Quick Look and Android Scene Viewer. If most of your traffic is desktop, most of your visitors cannot use the feature at all, and the interaction design questions that come with phone-based 3D are their own discipline, covered in mobile 3D product interaction. Check your analytics before believing any lift projection.
How to get your own number
Run it as a test, not a rollout. Pick a handful of comparable products, add AR to half, and compare conversion and returns between the groups over a meaningful window, six weeks or more, because small samples lie. Segment by device, since the mobile segment carries the effect and the desktop segment dilutes it. Watch returns as closely as conversion; a lift that comes back as returns is not a lift.
Write down, before the test starts, what result would change your mind in either direction. A test without a pre-committed threshold turns into a debate, and debates get settled by whoever is more persistent, which is usually the person selling something.
Do that and you will have something better than anyone's case study: your number, on your catalog, with your traffic. If the test comes back ambiguous and you want help reading it, or you are stuck earlier, deciding whether AR belongs on your store at all, tell us about your products. We would rather talk you out of a bad build than into one.
FAQ
Q: What AR conversion lift can I expect on Shopify?
Nobody can promise a number, and anyone who does is repeating someone else's case study. Published figures range from a 3% cart lift to a 40% order conversion lift, on different products with different measurement methods. The honest expectation for a spatial-uncertainty category with decent mobile traffic is a measurable lift; its size is what your own test is for.
Q: Does the 65% figure mean 65% more sales?
No. It means shoppers who interacted with a product in AR were 65% more likely to purchase than those who did not, at one fashion brand. Self-selection inflates it: people who tap AR buttons were better prospects already. Read it as directionally positive, not as a forecast.
Q: Is AR worth adding to a Shopify store?
It earns its place where scale, fit or finish drive the purchase and returns are costly, furniture, large products, made-to-order goods. It rarely pays for small, cheap, style-driven products. Model quality and mobile traffic share decide whether the feature helps or hurts.